
In our data journalism class with John Burn-Murdoch today, we were taught how to use cartodb.com – a useful online tool for creating interactive maps out of spreadsheet data.
We downloaded data on unemployment in each local authority district in the UK from Nomis Web, and then downloaded mapping data from the Office for National Statistics’ geoportal.
We then merged the data, uploaded the result to cartodb.com – and hey presto:
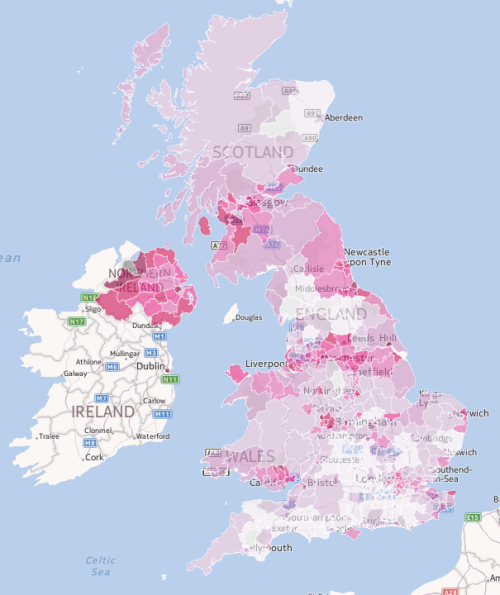
Unemployment in the UK by local authority district
If you click the above, you’ll be taken through to the interactive map that’ll allow you to zoom in and see the specific numbers.
Bear in mind, when looking at the map, that the percentages refer only to people on the claimant count – and so might be lower than you would’ve expected.


Reblogged this on What Journalism.